

DSO collections is how a business’s collection process affects its days sales outstanding (DSO). DSO measures the average number of days it takes to convert billed revenue into cash.
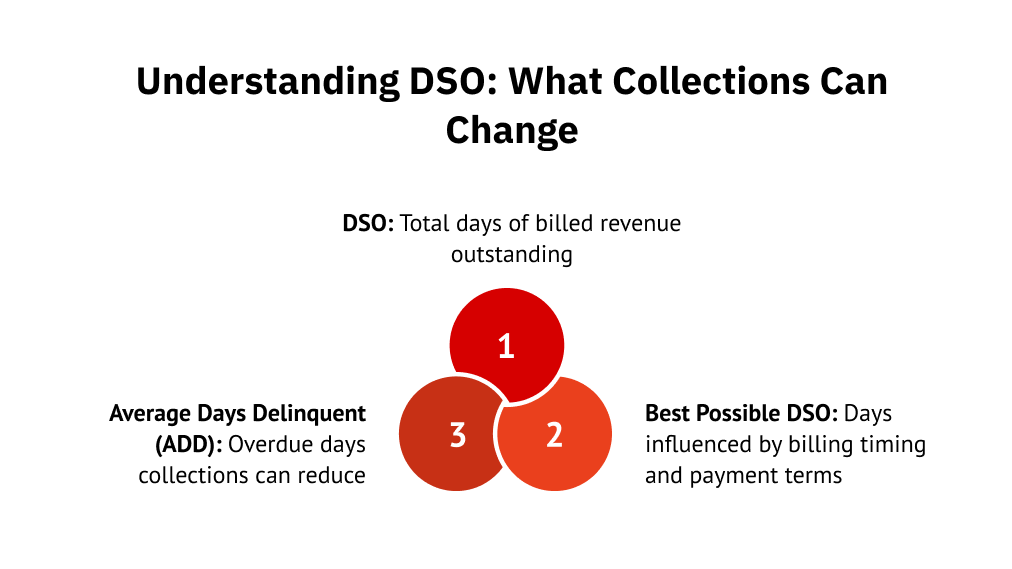
That single number, however, combines two very different things. One part reflects your billing cycle and payment terms. The other reflects overdue balances your collections team can reduce.
Half of all B2B invoices in the United States were past due in 2024, according to the Atradius Payment Practices Barometer. Those overdue invoices took an average of 20 extra days to collect.
For healthcare providers, utilities, telecom companies, and subscription businesses, each of those days holds cash in receivables instead of in the bank.
This guide separates the DSO days your billing cycle sets from the overdue days collections can influence. It then walks through how to measure, diagnose, and reduce the days that are yours to change.
What is DSO in collections?
DSO in collections measures how many days of billed revenue remain uncollected, and how much of that gap your collection process can close. Days sales outstanding (DSO) is the average number of days it takes to turn credit sales into cash.
Two forces drive the number. Billing cycles and payment terms set a baseline. Overdue balances add days on top. Reducing DSO means knowing which force moved it.
The DSO formula, with a worked example
DSO equals accounts receivable divided by total credit sales, multiplied by the days in the period.
DSO = (Accounts Receivable ÷ Total Credit Sales) × Days in the Period
Example: $1.5 million in unpaid balances and $3.6 million billed over a 90-day quarter.
($1,500,000 ÷ $3,600,000) × 90 = 37.5 days
Of those 37.5 days, some are set by when invoices go out. Collections teams focus on the days after the due date passes.
| Pro tip Count only revenue billed for later payment. Payments collected at the point of service never enter receivables. Including them understates the overdue days your team needs to work. |
The formula tells you where DSO stands. Understanding its cost requires one more calculation.
How DSO connects to cash flow and working capital
Every day of DSO holds one more day of billed revenue in receivables instead of in the bank.
Multiply average daily credit sales by DSO to estimate the cash tied up. If daily credit sales are $100,000 and DSO is 46, that is $4.6 million locked in receivables. When the overdue portion grows, so does the cash your business cannot use.
However, DSO is a portfolio-level number. It does not show what is happening inside individual accounts.
Why DSO isn’t the time it takes to collect one bill
DSO compares total receivables with total credit sales. It does not track how long any single invoice took to collect.
As a result, a few large overdue accounts can hide behind thousands of on-time payments. The average stays flat while collection risk builds in one segment. To find the days your team can reduce, split DSO into two parts.
How collections affect DSO: Best Possible DSO vs. Average Days Delinquent
Collections reduce DSO by shortening the overdue days above the due date. Splitting DSO into Best Possible DSO and Average Days Delinquent (ADD) reveals this divide. It shows which days belong to billing and which belong to collections.
The table below compares all three metrics.
| Metric | Formula | What it shows | Main influences |
| DSO | (Accounts receivable ÷ Total credit sales) × Days | Total days of billed revenue still outstanding | Billing and collections together |
| Best Possible DSO | (Current AR ÷ Total credit sales) × Days | Days set by billing timing and due dates | Billing setup and payment policy |
| Average Days Delinquent (ADD) | DSO − Best Possible DSO | Days balances stay unpaid after the due date | Collection processes, disputes, and customer finances |
Best Possible DSO: the days your billing cycle sets
Best Possible DSO measures the DSO your business would have if every customer paid on time. It equals current receivables divided by total credit sales, multiplied by the days in the period.
Three factors move this number:
- When you send statements
- How many days your payment terms allow
- Whether bills are accurate
Collection activity has little effect on any of them.
Best Possible DSO sets the floor. Everything above that floor is where collections come in.
Average Days Delinquent: the days collections can influence
ADD equals DSO minus Best Possible DSO. It isolates the days balances stay unpaid past the due date.
Several collection activities reduce ADD:
- Pre-due reminders
- Follow-up cadence and coverage
- Self-service payment access
- Fast dispute resolution
First-party collection programs that reach customers before balances age can lower ADD before accounts need later-stage recovery.
However, billing disputes and customer financial situations also play a role. ADD does not move on collection effort alone.
| Did you know? If ADD fell to zero, DSO would equal Best Possible DSO. The remaining DSO at that point comes from billing alone. |
What is a good DSO? Benchmark it against your billing cycle
A good DSO is one that stays close to your own billing cycle and payment terms. No single target applies across industries or billing models.
Four variables shift the number:
- Due dates and payment terms
- The share of revenue billed for later payment
- Seasonal billing patterns
- How your team calculates the period
Compare within your own business instead. Use the same customer segment, the same reporting method, and the same period over time.
Then read your DSO against your own Best Possible DSO. The gap between the two is your ADD. That gap is what your collections process can shrink. Track these patterns to spot where the issue sits.
| What the metrics show | What to investigate |
| DSO close to your due-date window | Little action needed. Track ADD monthly |
| DSO rises, and ADD rises | Overdue balances, follow-up gaps, disputes, failed payments |
| DSO rises, and ADD stays stable | Billing timing, due-date changes, a shift in service or customer mix |
| One customer segment has much higher ADD | Contact coverage, dispute reasons, payment behavior, and escalation timing in that segment |
According to the Credit Research Foundation’s Q2 2026 survey, the median DSO across reporting firms was 37.50 days. Best Possible DSO was 34.00 days. That puts median ADD at just 3.70 days.
These figures reflect a broad mix of industries and billing models. Your own ADD trend over time is a more reliable signal.
| Pro tipYour own ADD trend is a better benchmark than another company’s DSO. Businesses with different billing models will make your total DSO look better or worse than it really is. |
Why DSO alone can mislead your collections team
DSO can move for reasons that have nothing to do with collection performance. Billing volume, seasonality, and customer mix all shift DSO even when your team collects overdue balances at the same pace.
Two common scenarios show how this happens.
Billing volume and seasonality
A surge in new bills or enrollments can lower DSO even while overdue balances grow. New receivables are current on day one. They pull the average down. Meanwhile, the overdue balances your team is working stay the same or rise.
The reverse also happens. Seasonal billing peaks, such as annual renewals or heating season, can raise DSO even when collections stay on track.
In both cases, DSO moved without any change in collection results. A second metric helps confirm whether your team’s performance actually shifted.
Cross-check with the Collection Effectiveness Index (CEI)
The Collection Effectiveness Index (CEI) measures the share of collectible balances your team actually collected in the period.
CEI = (Beginning AR + Credit sales − Ending total AR) ÷ (Beginning AR + Credit sales − Ending current AR) × 100
Use DSO and CEI as complementary signals. Neither one alone proves why performance changed. The table below shows how to read them together.
| DSO trend | CEI trend | Possible signal | What to check |
| Down | Down | Billing growth may hide weaker collection | Billing volume, aging, write-offs, and account mix |
| Flat | Up | Collections improving while billing timing holds DSO steady | Best Possible DSO, billing timing |
| Up | Down | Collection performance may be slipping | ADD by segment, follow-up coverage, and disputes |
Once you confirm that collection performance drove the change, the next step is finding the specific cause.
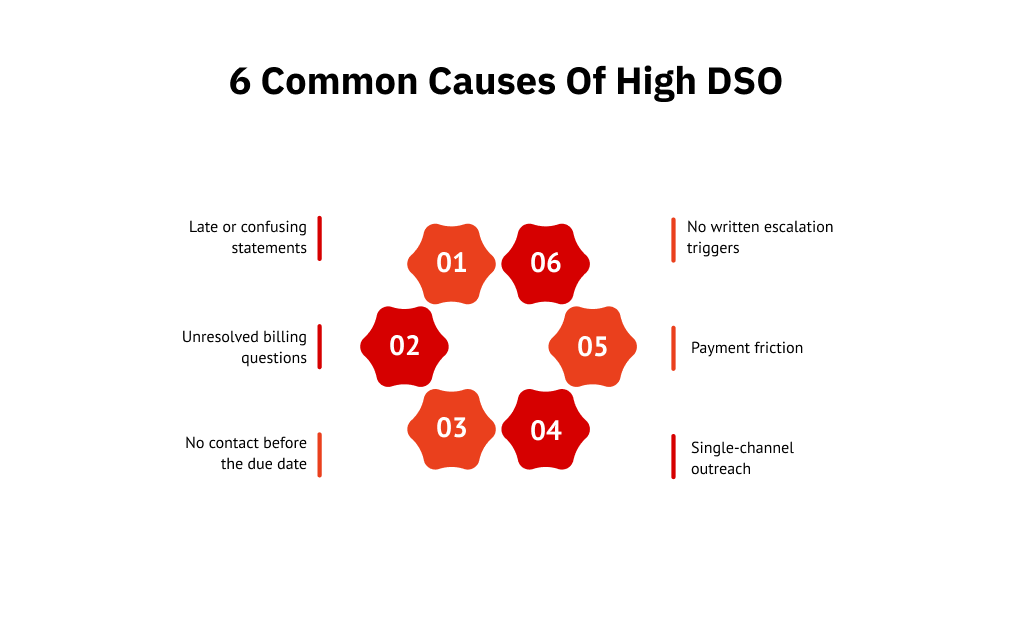
6 common causes of high DSO
High DSO grows from two directions. Billing-side issues delay when customers can pay. Collection-side gaps let overdue balances sit longer after the due date.
Each side needs a different fix. More follow-up calls won’t solve a billing problem. Shorter payment terms won’t close a collection gap.
Billing-side causes
These two causes raise Best Possible DSO. They push payment later before collections get involved at all.
1. Late or confusing statements: Delayed bills give customers fewer days to pay within the term window. Unclear line items do the same. A customer who can’t match a charge to a purchase order will wait rather than pay the wrong amount.
2. Unresolved billing questions: Customers who dispute a charge often pause payment on the entire invoice. The dispute sits in billing, but the delay shows up in receivables. That balance grows older every day until someone resolves the question.
Collection-side causes
These four causes raise Average Days Delinquent (ADD). They slow collection after balances pass the due date.
3. No contact before the due date: Many teams send the first reminder only after a balance is already late. By then, the customer may have set the payment aside. A pre-due nudge catches balances before they turn overdue.
4. Single-channel outreach: Phone-only or mail-only follow-up misses customers who respond faster by text, email, or self-service portals. Omnichannel debt collection strategies that reach customers on their preferred channel close these gaps sooner.
5. Payment friction: No online payment option, no installment plans, or failed autopay attempts that go unaddressed all stall collection. Even a willing customer delays payment when the process is hard.
6. No written escalation triggers: Without clear rules for when to change the approach, accounts age quietly. A 60-day balance gets the same treatment as a 30-day balance. Clear escalation steps create urgency at each stage.
Each cause maps to a specific step in the framework below.
How to reduce DSO through collections: a 7-step framework
DSO reduction starts with isolating the overdue days collections can influence, then working them down one step at a time. This table shows the full sequence and the metric each step targets.
| Step | Action | Metric it moves |
| 1 | Record a baseline and segment it | All (sets the reference point) |
| 2 | Tighten billing and point-of-service payment | Best Possible DSO |
| 3 | Contact customers before the due date | ADD (prevents overdue days) |
| 4 | Prioritize outreach by risk, not age | ADD on high-value segments |
| 5 | Remove payment friction | ADD (friction-driven days) |
| 6 | Answer billing questions on their own track | ADD and dispute-resolution time |
| 7 | Set escalation triggers and measure | ADD (prevents silent aging) |
Step 1: Record a baseline and segment it
Record DSO, Best Possible DSO, ADD, CEI, total overdue balance, and average dispute-resolution time before you change anything. These six numbers become the comparison point for every step that follows.
Company-wide averages hide where overdue days concentrate. Break every metric down by customer segment, service line, and balance size. If healthcare accounts show ADD of 12 and telecom shows ADD of 3, you know where to focus.
Step 2: Tighten billing and point-of-service payment
Collect what is due at the time of service where possible. Co-pays, deposits, and upfront subscription charges collected at service never enter receivables at all. For billed accounts, send statements within 24 to 48 hours. Each statement should show the amount matched to the invoice number, the due date, and a direct payment link.
A bill that arrives five days late gives the customer five fewer days to pay within terms. That raises Best Possible DSO before collections ever gets involved.
Step 3: Contact customers before the due date
A pre-due reminder three to five days before the due date, followed by a notice on the due date itself, can keep balances from turning overdue at all. The message should confirm the amount, the due date, and how to pay. Two contacts before the due date reduce the volume entering your AR collections queue.
Step 4: Prioritize outreach by risk, not age alone
Most aging reports sort accounts oldest first. That pushes small, long-overdue balances to the top while large, newly overdue balances wait in the queue. A $50,000 balance at 35 days holds far more working capital than a $500 balance at 90 days.
Reorder by cash impact instead. Score each account by balance size, days past due, and past payment behavior. Then sequence outreach in order:
- Digital first (email, SMS, or a self-service payment link)
- Phone for accounts that do not respond within a set window
- Chat for customers who engage digitally but have not paid
Run every channel as one coordinated sequence. Each touchpoint should inform the next. Keep all contact within the federal and state debt collection compliance rules that apply to your accounts.
Step 5: How First Credit Services removes payment friction
Payment friction adds overdue days even when the customer intends to pay. A missing online option, a confusing portal, or no installment plan keeps balances open longer than they need to be.
First Credit Services removes that friction through its proprietary platform, the Unified Consumer Engagement Platform (UCEP). First Credit Services operates UCEP entirely on the client’s behalf. The platform gives each customer a white-labeled, mobile-first portal where they can view balances, choose a payment plan, or start a chat without waiting for an agent.
Each payment link is personalized. The customer clicks and lands on their balance and options directly. No login, no account number entry. Hundreds of thousands of active consumers use the portal today.
This model fits businesses placing large or recurring portfolios with a collections partner. Smaller portfolios with simple billing are often better served by in-house payment tools.
Step 6: Answer billing questions on their own track
A disputed invoice stalls payment on the entire balance. If the dispute sits unresolved, that balance ages in receivables and raises ADD. The cause is billing, but the cost shows up in collections.
Route every billing question to a named owner with a response deadline. Pause collection outreach on that account until the question is answered. Track each dispute reason. If 30 percent of disputes cite unclear line items, the fix is a clearer statement template, not more follow-up calls. Recurring patterns point to billing fixes that prevent future ADD from building at the source.
Step 7: Set escalation triggers and measure against your baseline
Without written triggers, accounts age quietly. A 60-day balance gets the same treatment as a 30-day balance. Recovery odds drop with every passing week. Define specific triggers that change the approach: a broken payment promise, two unanswered contacts in a row, or an aging threshold per segment (for example, 45 days for high-value, 60 for low-value).
After a set review window, compare results to the Step 1 baseline. Before crediting the change to collections, check whether billing volume or customer mix shifted during the same period. CEI and ADD together confirm whether collection performance improved or external factors moved the numbers.
Each step targets a specific metric. The worked example below shows what those improvements are worth in dollars of working capital.
What reducing overdue days is worth: a worked example
Each day of ADD reduction frees one day of average daily credit sales from receivables. A business billing $3 million per month has $100,000 in daily credit sales. A seven-day ADD cut releases roughly $700,000 in working capital.
To size that number for your own portfolio:
- Divide monthly billed revenue by 30 to get daily credit sales.
- Split current DSO into Best Possible DSO and ADD.
- Estimate how many ADD days your collection changes can cut.
- Multiply daily credit sales by the days cut.
| Metric | Before | After |
| Monthly billed revenue | $3,000,000 | $3,000,000 |
| Daily credit sales | $100,000 | $100,000 |
| Best Possible DSO | 33 days | 33 days |
| ADD | 13 days | 6 days |
| DSO | 46 days | 39 days |
| Receivables outstanding | $4,600,000 | $3,900,000 |
The seven-day cut moves $700,000 from receivables into available cash. This assumes daily credit sales hold steady. The amount is cash freed from receivables, separate from revenue or profit.
Run this estimate before you approve any collections spend. State the case in dollars of working capital. Finance leaders act faster on a $700,000 release than a “seven-day improvement.”
Track and improve your DSO collections performance
DSO combines the days your billing cycle sets with the overdue days your collection process can change. Measure that split. Review ADD weekly. If it rises two weeks in a row, check pre-due reminders and channel coverage. Review CEI and Best Possible DSO monthly against your baseline.
Steady ADD reduction releases working capital each month.
If you bring in a partner, ask how they report ADD and CEI for the accounts they handle. Ask how often. Without those numbers, you cannot tell whether a DSO shift came from their work.
First Credit Services runs first-party and third-party collection programs that target ADD across large portfolios. The team reports ADD and CEI to clients on a set schedule.
Talk to First Credit Services about a portfolio review. Find out how many of your DSO days are overdue days that collections can address.
FAQs
1. Can seasonal billing distort DSO?
Yes. A billing surge lowers DSO by raising credit sales in the formula, even if overdue balances stay the same. A billing dip does the opposite. Compare DSO to the same quarter last year to remove seasonal noise.
2. Is it always better to lower DSO?
Not always. Pushing DSO too low can mean tight credit policies that turn away good customers. The goal is to lower overdue days (ADD) while keeping terms competitive enough to win business.
3. How does DSO differ from an aging report?
DSO is a single number that shows average collection time across all receivables. An aging report groups open balances by how long each one has been due. DSO tracks the trend. The aging report shows which accounts drive it.
4. Do early payment discounts lower DSO?
Yes, when customers take them. A discount like 2/10 net 30 gives customers a reason to pay before the due date. Earlier payments shrink average receivables and lower DSO. Track whether the discount cost is worth the cash flow gain.
5. How do partial payments affect the DSO calculation?
A partial payment reduces the outstanding balance on that account. DSO uses total accounts receivable, so any payment lowers the numerator. The unpaid portion stays in receivables and continues to age until the account is fully collected.
6. Does changing payment terms automatically change DSO?
Not automatically. Shorter terms lower Best Possible DSO by moving the due date earlier. Actual DSO drops only if customers pay faster. Without better follow-up, shorter terms just shift when balances become overdue.