


Two accounts can be 60 days overdue and need very different treatment. One customer may pay after a reminder, while another may need a manageable payment plan. Yet a queue sorted by balance and account age gives your team limited guidance on what to do next.
Delinquency trends heighten the stakes further. According to the Federal Reserve Bank of New York, the credit card serious-delinquency transition rate reached 7.18% in Q4 2024, up from 6.36% a year earlier.
To guide those decisions, debt collection predictive analytics applies predictive models to historical account data. These models estimate payment likelihood, contact timing, channel response, and expected recovery. Those estimates help your team prioritize attention and tailor its approach to each account.
This guide explains which models support those decisions, how to turn scores into collection workflows, and where data and implementation problems can undermine results.
What predictive analytics does in debt collection
Traditional collection operations often prioritize accounts using two variables: balance size and days past due. For example, a high-balance account at 60 days may go to the front of the queue regardless of whether that consumer intends to pay.
To refine that prioritization, predictive analytics evaluates dozens of behavioral variables simultaneously. These include payment history, past contact outcomes, channel responsiveness, account age, and external credit signals.
Using these signals, models generate scores and forecasts that answer four questions central to collection decisions:
- Payment likelihood: How probable is it that this consumer will pay within a given window?
- Contact timing: When is the consumer most likely to answer or respond?
- Channel preference: Will SMS, email, phone, or a self-service portal produce engagement?
- Expected recovery amount: How much is recoverable, and under what terms?
Together, these predictions help collection managers build prioritized queues. Thus, agents can focus on accounts likely to respond to intervention. Accounts with lower payment probability receive outreach through digital channels that scale without adding headcount. The advantage becomes clearer at scale. A skilled collector can assess a handful of accounts in depth and make informed decisions about each one.
However, across 50,000 accounts, machine learning (ML) can help identify broader patterns, such as correlations between email open rates and payment plan enrollment. Those insights give your team additional context for deciding how to approach each account.
| Pro tip: Predictive analytics and artificial intelligence (AI) are related concepts that serve different roles. Predictive models forecast outcomes using statistical patterns. AI is the broader category that includes the ML algorithms powering those models. This difference matters when evaluating vendor claims about their technology. |
How propensity-to-pay scoring prioritizes the right accounts
A propensity-to-pay score is a probability, typically expressed on a 0 to 100 scale. It estimates how likely a consumer is to repay within a defined window. The higher the score, the stronger the likelihood of payment.
Several categories of data feed into the score:
- Internal data: payment history, account age, outstanding balance, previous contact outcomes, and channel responsiveness
- External signals: credit bureau data, demographic indicators, and employment signals
- Behavioral data: whether the consumer opened a prior email, clicked a payment link, or visited a self-service portal
Once scores are assigned, prioritization shifts in the following ways:
- High-probability accounts are prioritized for immediate outreach, either through agents or appropriate digital channels.
- Moderate-probability accounts receive semi-automated contact through a mix of channels.
- Low-probability accounts route to digital sequences such as SMS reminders or email payment links.
A low score signals the need to adjust the approach under current conditions. In such situations, a more tailored method often produces a better outcome.
For example, an extended payment plan, a settlement offer, or a self-service option can give the consumer more control. It also helps your team customize engagement to each consumer’s situation.
| Did you know? Propensity-to-pay models separate accounts likely to resolve on their own from those needing active intervention. This self-cure identification stops agents from calling on balances that would have cleared anyway and focuses effort where outreach changes the outcome. |
Five predictive models that shape collection strategy
Effective collection analytics relies on more than a single score. The following five model types work together to build a complete picture of each account.
| Model | What it predicts | Why it matters |
| Cure model | Whether an account will return to good standing without intervention | Identifies self-cure candidates so resources focus elsewhere |
| Roll-rate model | Whether an account will progress to a deeper delinquency bucket | Flags accounts needing immediate action before they worsen |
| Propensity-to-pay model | Payment likelihood under different scenarios (full, settlement, plan) | Guides offer strategy and agent prioritization |
| Contact model | Best time, channel, and frequency for reaching a specific consumer | Determines whether voice, SMS, email, or self-service produces engagement |
| Payment projection model | Expected recovery amount and installment sustainability over time | Informs decisions on restructuring, settlement, or escalation |
Additional model: Re-default prediction
Some advanced operations also use a re-default model to estimate whether a consumer may default again after entering a restructured payment plan. Although less common, this model helps your team identify arrangements at risk of failing and allocate follow-up resources accordingly.
How the models work together
Each model answers a different collection question:
- Propensity-to-pay models estimate who is likely to pay within a given period.
- Contact models identify when and through which channel a consumer is most likely to respond.
Combining these predictions gives your team clearer direction on which accounts to prioritize and how to engage each consumer.
From scoring to action: how analytics runs in a live operation
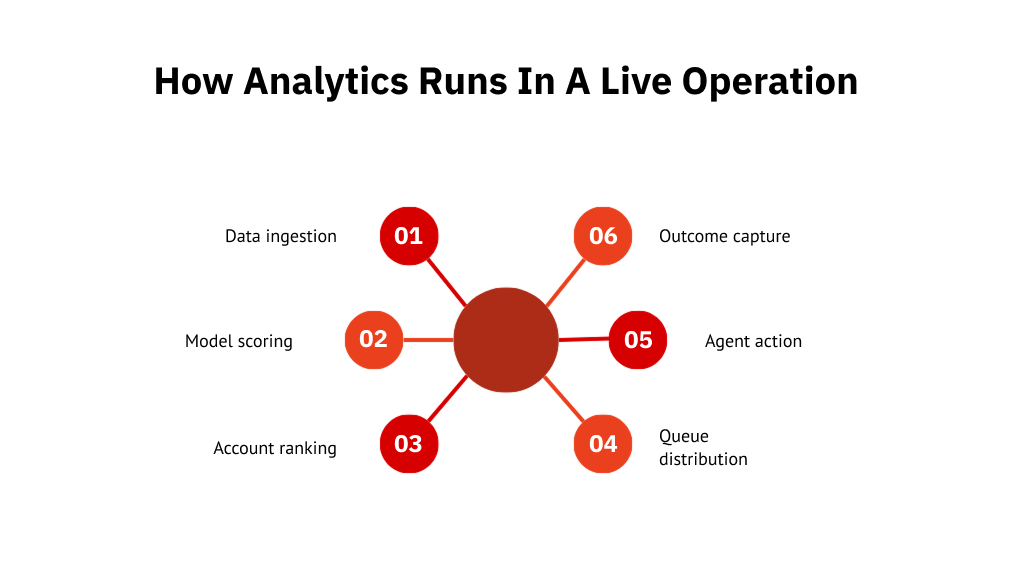
Scoring accounts is only the first step. The real value emerges when scores feed directly into operational workflows, following a six-step cycle.
- Data ingestion: Account records, contact history, payment data, and external signals flow into the analytics engine.
- Model scoring: Each account receives probability scores across the active model types.
- Account ranking: Scored accounts are ranked and sorted into priority tiers.
- Queue distribution: High-probability accounts go to agent queues for immediate omnichannel outreach. Moderate accounts enter semi-automated sequences. Low-probability accounts route to digital channels.
- Agent action: Collectors work their queues with context: the score, the recommended channel, and the suggested next step.
- Outcome capture: Every interaction, whether successful or unsuccessful, feeds back into the system.
Step six separates analytics programs that compound from those that plateau. Every call answered, SMS ignored, and payment completed becomes training data for the next scoring cycle. As a result, month-two predictions are measurably better than month one.
Agent adoption is equally important. Collectors may hesitate to act on a score they cannot interpret.
To build trust, pair each score with a brief explanation of the factors behind it and a recommended outreach action. Agents can then understand the reasoning behind the recommendation and apply it with confidence.
Where predictive analytics fits across the collection lifecycle
Predictive models serve different purposes depending on where an account sits in the delinquency timeline. Matching the right model to the right stage determines both efficiency and recovery rate.
| Stage | Timeline | Primary focus | Key models | Typical channels |
| Early-stage | 0 to 90 days past due | Self-cure identification, light-touch engagement | Cure, contact | SMS, email, self-service portal |
| Mid-stage | 90 to 180 days past due | Treatment optimization, settlement, and restructuring | Propensity-to-pay, payment projection | Voice, SMS, email, payment plans |
| Late-stage | 180+ days past due | Recovery economics and placement decisions | Payment projection, roll-rate | Legal notice, hardship programs, third-party agency placement |
- Early-stage (0 to 90 days past due): Cure models and contact models do the heavy lifting here. The goal is to prevent roll-forward without burning expensive agent hours. Many early-stage accounts self-cure with a timely SMS reminder or email payment link. Predictive scoring identifies which need only a light touch and which require early intervention.
- Mid-stage (90 to 180 days past due): Treatment optimization produces the highest return here. Propensity-to-pay and payment projection models guide decisions on settlement offers, restructured payment plans, and the intensity of agent involvement. A consumer who scores high on payment likelihood but low on full-payment probability may respond best to a structured settlement offer.
- Late-stage (180+ days past due). Payment projection models determine whether continued in-house effort justifies the cost. The decision is economic: does the expected recovery exceed the collection expense? Accounts below that threshold may need specialty agency placement, legal action, or write-off. Channel strategy shifts to hardship programs and formal notices.
Across all three stages, contact models adjust the channel mix as accounts age, such as:
- Early-stage accounts often respond to digital outreach.
- Mid-stage accounts may require voice contact.
- Late-stage accounts may need formal correspondence.
Why predictive analytics programs fail (and how to avoid it)
Predictive analytics delivers measurable recovery gains when implemented well. However, several common mistakes cause programs to stall. Understanding these failure modes helps you avoid them.
Mistake 1: Treating it as a one-time implementation
Models degrade as consumer behavior and economic conditions shift. A model trained on pre-recession payment patterns will underperform in a rising-delinquency environment. Without regular retraining and performance monitoring, prediction accuracy declines within quarters. Therefore, plan for ongoing recalibration from day one.
Mistake 2: Using credit scores as collection scores
Bureau scores predict creditworthiness, meaning they estimate how likely someone is to default on a new obligation. Collection scores, by comparison, predict collectability, meaning they estimate how likely someone who has already defaulted is to pay under specific collection conditions.
A consumer with a low credit score may still be a high-probability payer in collections. Because these predictions serve different purposes, substituting one for the other distorts prioritization.
Mistake 3: Scoring accounts without changing workflows
A score sitting in a dashboard is information. When that score triggers a queue reassignment, a channel switch, or a settlement offer, it guides a collection decision.
However, many programs stall at the dashboard stage because teams have never redesigned workflows to act on the scores. Compliance frameworks also need to reflect the new decision logic so audit trails track why each account received its treatment.
Mistake 4: Ignoring data quality
If contact records are incomplete, outcome tracking is inconsistent, or payment data has gaps, models can learn the wrong patterns. Clean, consistent data capture is therefore the foundation. Without it, even well-designed models can produce unreliable scores.
| Pro tip: Start with a pilot. Score one portfolio segment and run the analytics-driven strategy alongside your existing approach for 60 to 90 days. Compare recovery rates, cost per dollar collected, and right-party contact rates. A controlled test builds internal confidence and surfaces data quality issues before you scale. |
How First Credit Services uses data-driven intelligence to improve recovery outcomes
The scoring and channel optimization outlined above require more than models. They require operational infrastructure that turns predictions into collection actions at scale.
First Credit Services delivers that infrastructure through AI-driven scoring that evaluates each account and determines the optimal contact strategy for every consumer in the portfolio.
The engine behind this capability is the Unified Consumer Engagement Platform (UCEP). It analyzes past interaction data to predict which channel, and timing will produce the best engagement across digital and voice outreach. In practice, that means:
- Accounts are scored and ranked by payment probability, so agents work the highest-opportunity accounts first.
- Each account is routed to the right channel automatically, whether that is voice, SMS, email, or a self-service portal.
- Every interaction outcome feeds back into the system, so predictions sharpen over each cycle.
Building a predictive analytics strategy: where to start
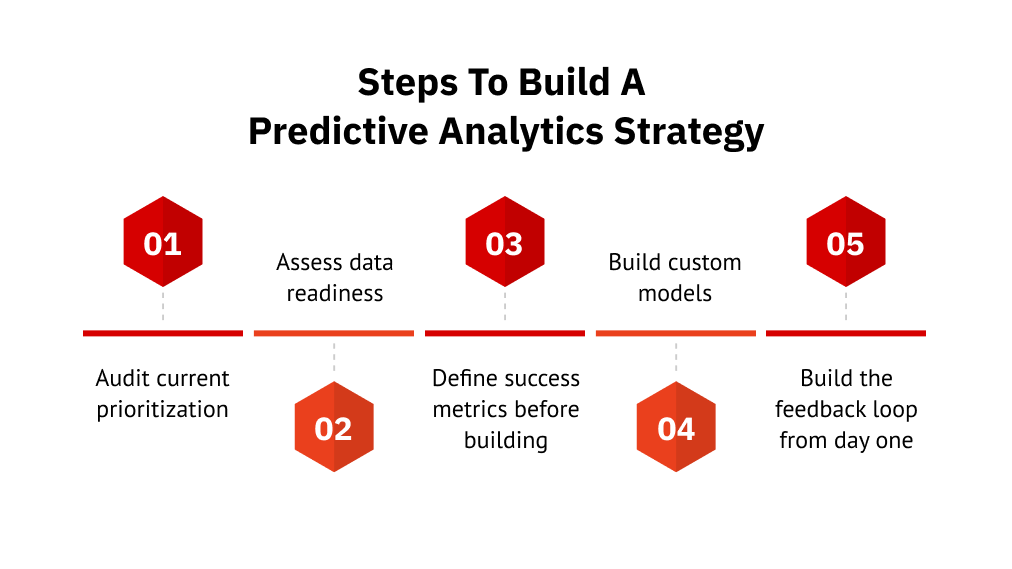
Deploying predictive analytics in collections requires preparation. These five steps provide a practical framework.
Step 1: Audit current prioritization
Start by documenting how your team works accounts today. If accounts are sorted only by balance or days past due, there is significant room for analytics-driven improvement. Map how queues are assigned and how agents choose which account to work next.
Step 2: Assess data readiness
Next, review your historical data and outcome tracking, starting with 6 to 12 months of records. That means documenting who paid, how much they paid, how many touches it took, and which channel produced the result.
Data gaps are normal in collection operations. However, identifying them upfront allows you to close them in parallel with model deployment.
Step 3: Define success metrics before building
Before deploying models, agree on what “better” looks like. Common metrics include recovery rate, cost per dollar collected, time to resolution, and right-party contact rate. These benchmarks then give you a basis for measuring whether the program delivers value.
Step 4: Build custom models
Generic models may overlook portfolio differences. Custom models trained on your specific consumer behavior, product types, and payment patterns can better reflect those differences.
For example, a healthcare portfolio with insurance-related payment delays behaves differently from an auto finance portfolio with seasonal income variation. Hence, the model needs to account for those patterns.
Step 5: Build the feedback loop from day one
Finally, plan for model retraining, performance monitoring, and drift detection from the start. Consumer behavior and economic conditions will continue to change after launch.
Ongoing recalibration based on new interaction data helps keep predictions aligned with those changes and sustain performance over time.
Turn debt collection predictive analytics into consistent recovery gains
Your team’s time is finite. Every account it prioritizes, channel it chooses, and payment arrangement it offers shapes your recovery results.
Debt collection predictive analytics gives those decisions a stronger evidence base. When scores guide daily workflows and outcomes inform model updates, your team can focus effort where intervention is most likely to matter.
The goal is to recover more while reducing unnecessary contacts and controlling collection costs. Measuring those outcomes shows whether your strategy is delivering.
Discuss with us how predictive scoring and channel optimization can support recovery across your portfolio.
FAQs
1. What is the difference between predictive and prescriptive analytics in debt collection?
Predictive analytics forecasts what is likely to happen, such as which accounts will pay and when. Prescriptive analytics recommends the best action based on those forecasts, including specific channel, timing, and offer combinations with the highest historical conversion rate.
2. How long does it take to see results from a predictive analytics program?
Most operations see measurable improvement within 30 to 60 days of deploying scored prioritization. However, results strengthen over the following months as models learn from new interaction data and the feedback loop refines prediction accuracy.
3. Can predictive analytics work with incomplete or messy data?
Yes. Real-world collections data is always imperfect. Predictive models learn patterns from available data and improve as data quality increases over time. Starting with what you have while improving data capture in parallel is the recommended approach.
4. Does predictive analytics raise compliance or bias concerns?
It can, and managing that risk is essential. Models trained on historical data may inherit biases affecting certain groups. The Fair Debt Collection Practices Act (FDCPA) and the Telephone Consumer Protection Act (TCPA) require careful attention. Best practice includes human oversight, fairness checks, and audit documentation.
5. What data sources feed a debt collection predictive model?
Typical inputs include internal data such as payment history, account age, balance, and past contact outcomes. External inputs include credit bureau scores and demographic indicators. Advanced models also incorporate behavioral data from digital interactions, such as email opens and payment link clicks.
6. How is collection scoring different from credit scoring?
Credit scores predict creditworthiness, estimating how likely someone is to default on a new obligation. Collection scores predict collectability, estimating how likely someone who has already defaulted is to pay under specific collection conditions.